Features / Reports & Dashboard
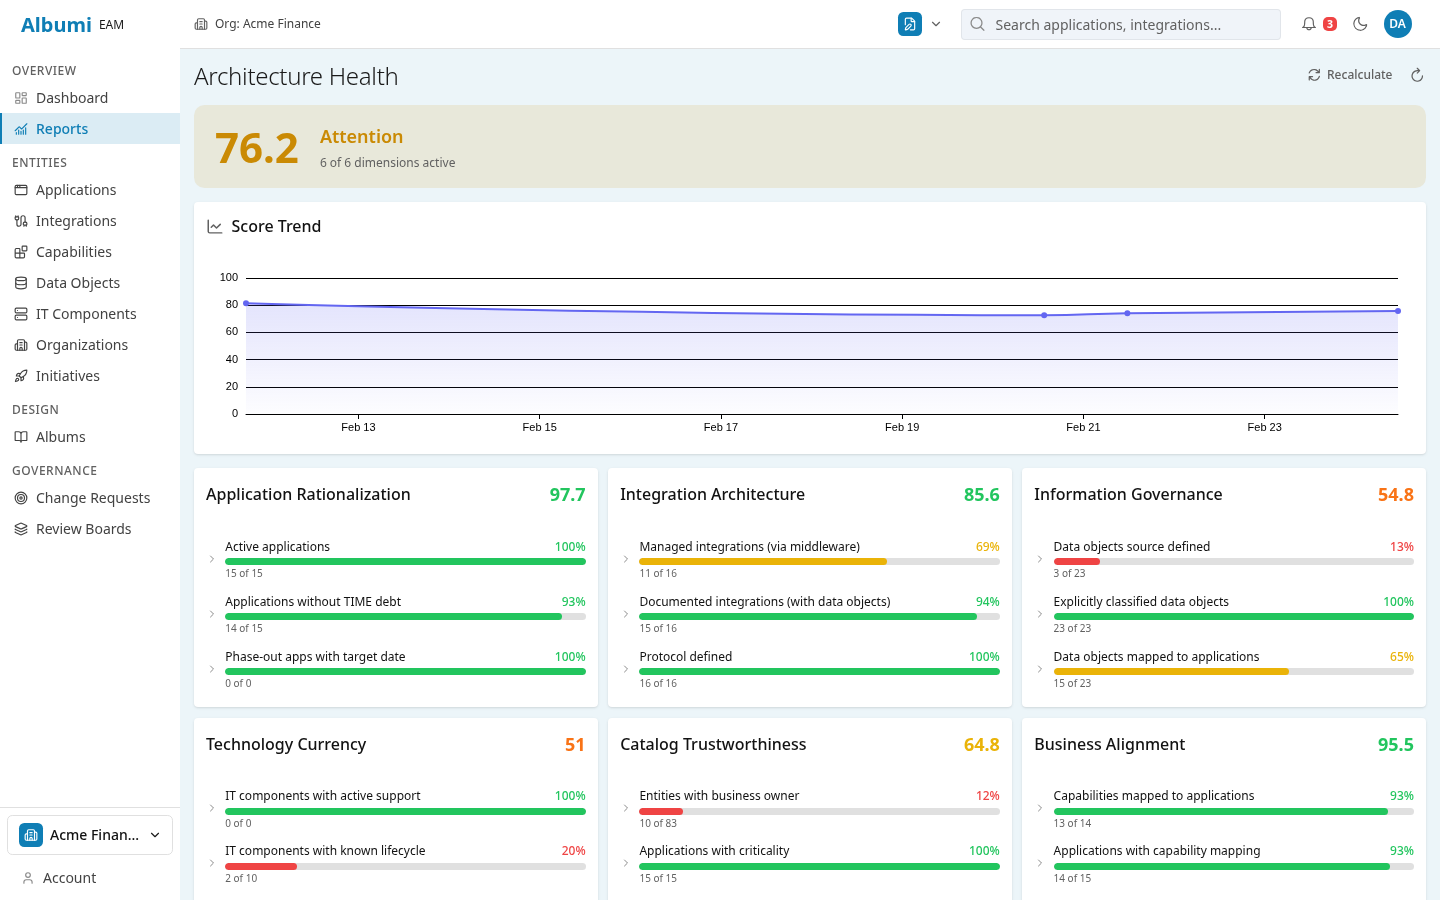
Architecture Health Dashboard
An architecture health dashboard gives you a single-screen overview of your IT landscape's state — how healthy is your portfolio, how many systems are being retired, where is technical debt concentrated. It turns raw architecture data into decisions.
Albumi's dashboard computes health scores from your actual architecture data — lifecycle distribution, TIME classification breakdown, integration coverage, and organizational ownership. No manual report building — the dashboard updates as your architecture evolves.
What You Can Do
Architecture Health Score
A single number that summarizes the health of your architecture — computed from lifecycle status, TIME classifications, integration coverage, and documentation completeness. Track it over time to see if your architecture is improving or degrading.
Lifecycle Distribution
See how many applications are in each lifecycle stage — Plan, Phase-In, Active, Phase-Out, End-of-Life. A healthy portfolio has most applications in Active with a manageable number in Phase-Out. Too many in End-of-Life? That's your technical debt backlog.
TIME Classification Breakdown
How many applications are you investing in vs. tolerating vs. eliminating? This is the strategic view your CTO needs — portfolio direction at a glance, without opening a spreadsheet.
Applications by Organization
See which teams own the most applications, which have the most end-of-life systems, and where ownership gaps exist. This drives the conversation about responsibility and resource allocation.
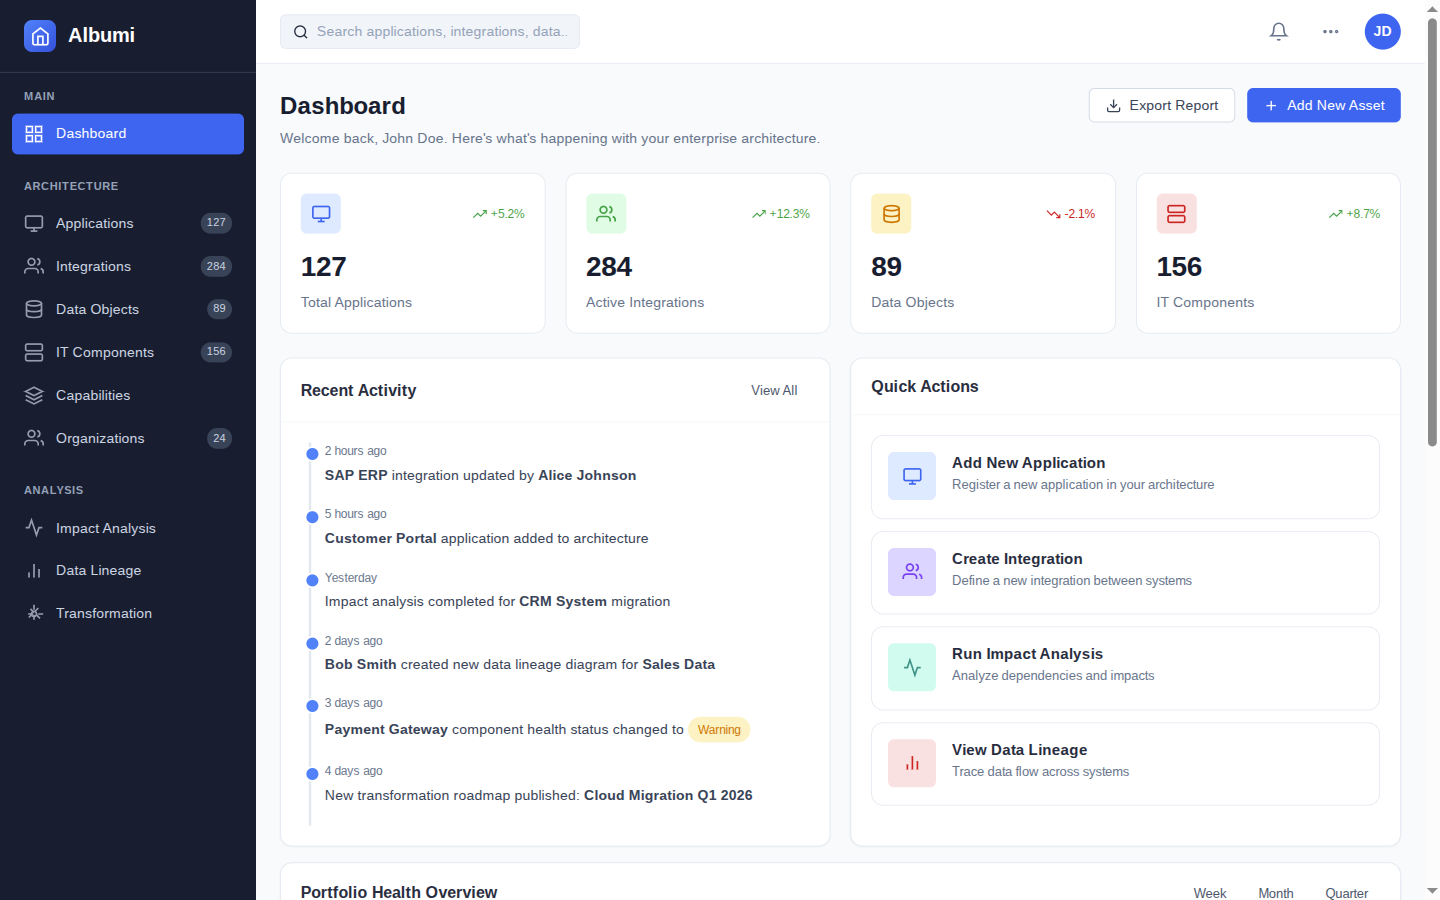
Portfolio Overview
Total applications, integrations, data objects, and business capabilities — your landscape in numbers. Simple but powerful: "We run 127 applications with 340 integrations" is the starting point of every architecture conversation.
Example: Quarterly Architecture Review
Every quarter, your CTO asks: "How's our IT landscape looking?" Instead of building a PowerPoint over 3 days, you open the dashboard. Health score is 72 (up from 68 last quarter). 8 applications moved from Phase-Out to End-of-Life. 3 new applications were onboarded. The Finance team still has 4 "Eliminate" applications with no migration plan.
The conversation shifts from "what's the status?" to "what should we prioritize?" — which is where the real value is.
Works Together With
Application Portfolio
The dashboard aggregates data from your application portfolio — lifecycle, TIME, criticality.
Business Capability Mapping
See capability coverage health — where you have gaps and where you're over-served.
Initiative Tracking
Track how strategic initiatives are changing your portfolio health over time.
See Your Architecture Health at a Glance
Sign up for early access and get data-driven architecture insights.
Get Early Access