Features / Integration & Data
Map Every Integration, Track Every Data Flow
Your integration landscape is the nervous system of your IT organization. Albumi gives you a central catalog of every integration — who sends what to whom, through which protocol, via which middleware — and then traces every data object from its System of Record to every consumer. Two capabilities that belong together, because integrations carry data and data flows through integrations.
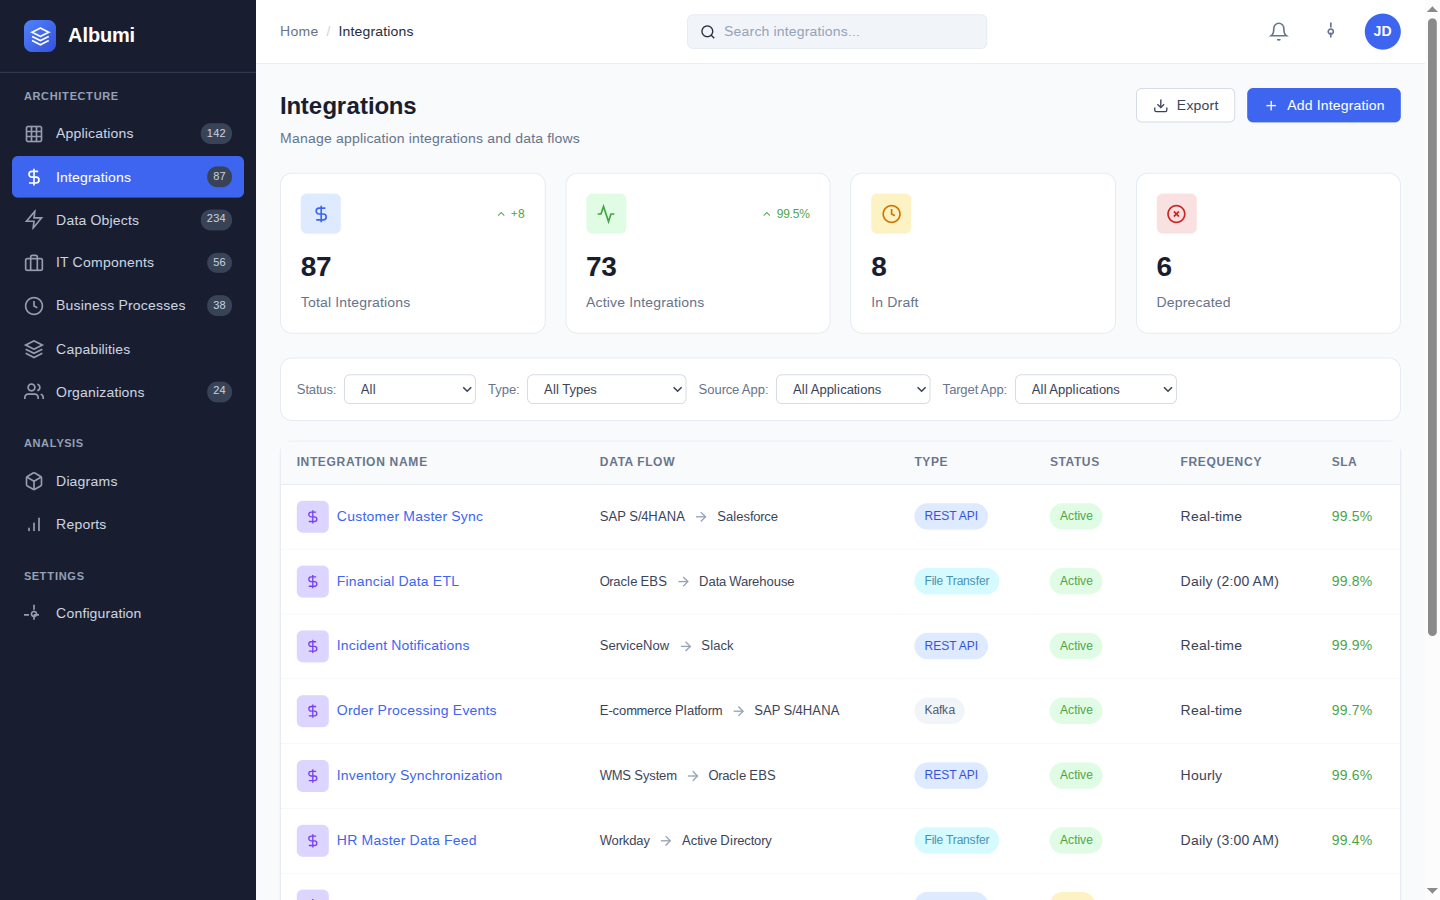
Integration Catalog
Source & Target Application Mapping
Every integration has a clear source and target application. See all outgoing integrations from any system, or all incoming data flows into it. No more guessing which systems are connected — one look at the catalog tells you everything.
Protocol & Format Tracking
Track the technical details that matter — REST, SOAP, file transfer, message queue. Know the data format (JSON, XML, CSV) and frequency (real-time, batch, on-demand) for every integration in your landscape.
Middleware Components
Integrations don't just go from A to B — they go through middleware. Track which integration platform, ESB, or iPaaS handles each integration so you know the full path, not just the endpoints.
Lifecycle Management
Track each integration through Plan, Phase-In, Active, Phase-Out, End-of-Life. Know which integrations are being built, which are stable, and which need to be migrated before time runs out.
Data Lineage
System of Record Assignment
Every data object has one authoritative source — the System of Record. Albumi lets you assign and track SoR for each data object, so you always know which system is the single source of truth for Customer, Order, Product, or any other entity.
Data Classification
Classify data as Public, Internal, Confidential, or Restricted. Each classification carries different handling requirements, and Albumi makes it visible at a glance — so compliance conversations start with facts, not guesses.
PII Tracking with Visual Indicators
Flag data objects that contain personally identifiable information. PII indicators show up everywhere — in lists, in lineage graphs, in impact analysis results. When a regulator asks where personal data flows, the answer is one click away.
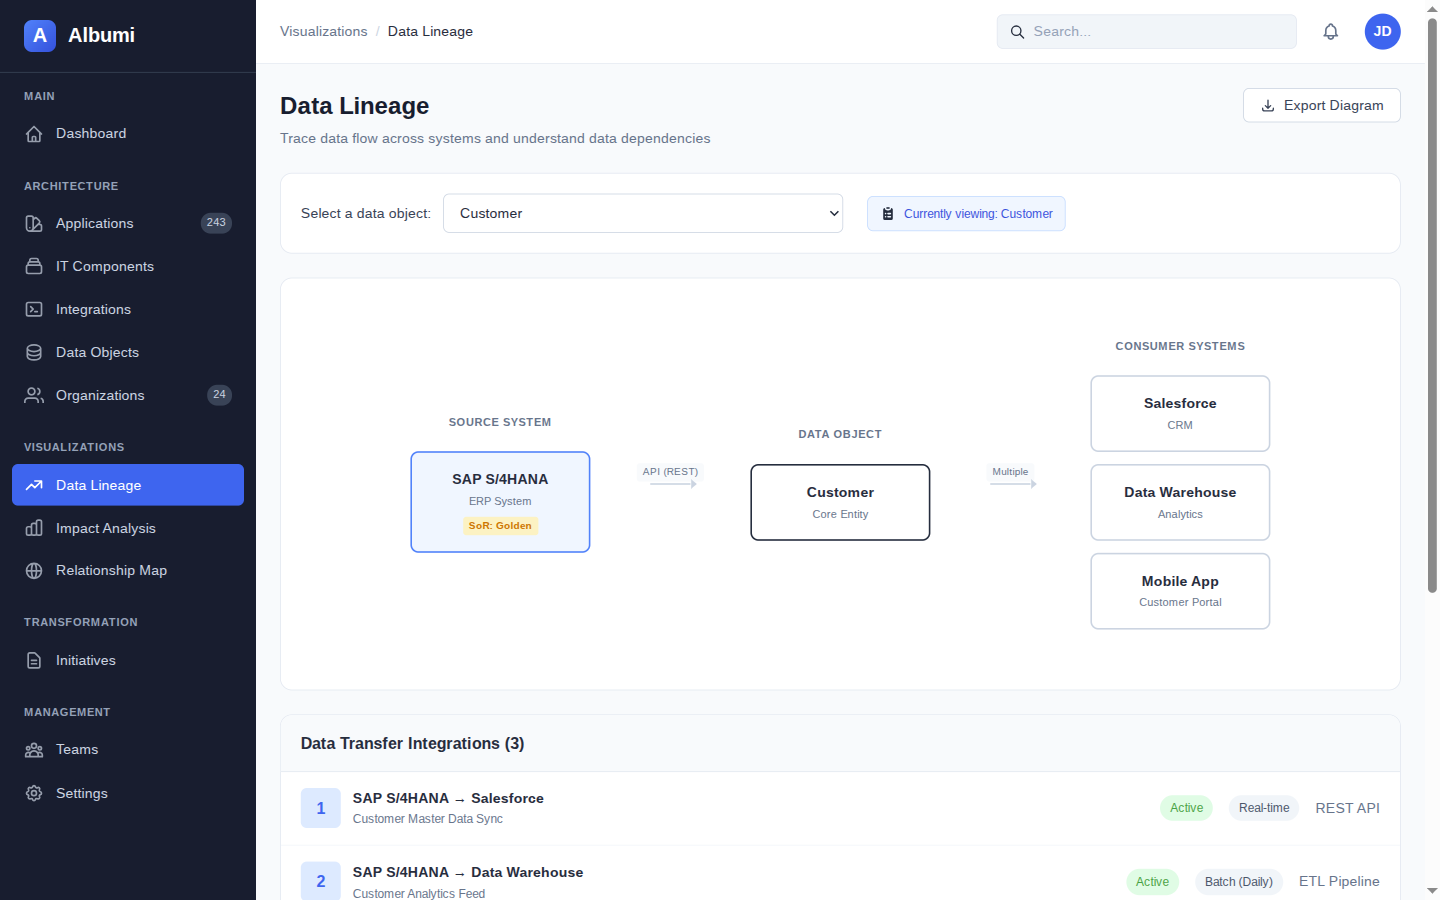
Source-to-Consumer Flow Visualization
See the full flow of any data object — from its System of Record through every integration to every consuming application. A visual lineage graph that shows exactly how data moves through your organization.
Hierarchical Data Object Organization
Organize data objects hierarchically — Customer contains Contact, Address, Payment Method. This gives you the high-level view for stakeholder conversations and the detailed view for technical work, in one structure.
How They Work Together
Integration catalog and data lineage are two sides of the same coin. Integrations are the pipes — data objects are what flows through them. In Albumi, they are connected by design.
Integrations Carry Data Objects
Every integration is linked to the data objects it transfers. Open any integration and see which data — Customer, Order, Invoice — flows through it. Open any data object and see which integrations carry it.
Change Integration, See Affected Data
When you modify, replace, or decommission an integration, you instantly see which data objects are affected. No more discovering broken data flows in production — you know the impact before you make the change.
Decommission System, Know What Migrates
When a system is being retired, Albumi shows you every integration that connects to it and every data object it owns as System of Record. You get a complete migration scope — not a partial one that misses critical data flows.
Practical Examples
Integration Audit After Growth
Your company has grown through acquisitions and now runs 80+ applications with hundreds of integrations between them. Nobody has a complete picture.
In Albumi, you catalog each integration with its source, target, protocol, and middleware. Now you can answer: "How many integrations go through our legacy ESB?" (23). "Which integrations still use file transfer?" (11). "What happens if we decommission the old ERP?" (14 integrations need to be migrated). What used to require weeks of interviews with integration developers is now a filtered view in your catalog.
GDPR Data Audit
A regulator asks: "Where does customer personal data live in your organization?" In Albumi, you open the "Customer" data object, flagged as PII. The lineage graph shows: System of Record is Salesforce, data flows via 6 integrations to the Data Warehouse, Email Service, Analytics Platform, Mobile App Backend, and two partner APIs.
You can answer the regulator's question in minutes, with a visual diagram as evidence. No spreadsheets, no guesswork, no 3-week audit project.
Works Together With
Impact Analysis & Visualization
See all integrations and data objects affected when you change or decommission an application. Full dependency graph with risk assessment.
Application Portfolio
See all integrations and data objects for any application in your portfolio. Every app page shows its connections at a glance.
Governance & Initiatives
Govern changes to integrations and data flows through Architecture Change Requests with approval workflows and initiative tracking.
Map Every Integration, Trace Every Data Flow
Sign up for early access and bring order to your integration and data landscape.
Get Early Access